Bitcoin Mining Dashboard
Daily Network Data (4 – 10 October 2026)
BTC Production & Miner Revenue
Top 5 Bitcoin Mining Pools
Top 5 Bitcoin Mining Countries
Top 5 Mineable Proof-of-Work Coins
Mining Cost and Profitability
ASIC Economics
FAQs

Hashrate increased or remained the same each day, from 968 to 1,003 EH/s, averaging ~986 EH/s, and momentarily reclaiming 1 ZH/s.
Difficulty was flat at 132.72T, so blocks were produced ~5.5% faster than the target time. Expect a similar upward adjustment at the next retarget. Unless the price of BTC rises, this will further compress the hashprice.
In the last week, about 3,324 BTC (~$274M) was mined, and fees were only ~0.7% of the subsidy.
The gross margin is healthy. With a spot price of ~$82.5K BTC and a production cost of ~$54.7K in the mid-case scenario, the gross spread is ~$27.8K/BTC (~34%). Rigs above ~27 J/TH are near or below break-even at $0.06/kWh.
The same high pool concentration is noted. Foundry USA, AntPool and F2Pool together produced more than 60% of the blocks.

 Part of a series
Hashrate was up about 4.6% this week, from a 7-day average of about 943 EH/s in the 16 September edition to about 986 EH/s this week. It climbed from 968 EH/s on Sunday to 1,003 EH/s on Saturday, and briefly went back over 1 ZH/s on Friday and Saturday. Difficulty held at 132.72T for the whole week. Because hashrate grew while difficulty stayed fixed, blocks were found faster than the 10-minute target: about 1,064 blocks at an average of 9.5 minutes, or about 152 blocks per day. That added roughly 3,324 BTC of block subsidy, about 5.5% above the theoretical 3,150 BTC. This pace points to an upward difficulty adjustment at the next retarget.
With BTC trading around $82–83K this week, miners were earning about $39.3/PH/day, based on that price and the week's difficulty. This is about the same as the previous edition, as the higher BTC price was offset by greater difficulty. Fees remained very low this week, at about 0.7% of the block subsidy. These numbers are typical for 2026. Roughly 3,324 BTC was issued this week, almost entirely from the 3.125 BTC block subsidy, with fees adding only about 23 BTC on top.
| Metric | This week (4–10 Oct) | Comment |
|---|---|---|
| BTC price | ~$82.5K | Market price reference used in the report |
| 7-day avg. network hashrate | ~986 EH/s | Average of daily Hashrate Index values |
| Hashrate range (daily) | 968 – 1,003 EH/s | Rose or held steady every day; crossed 1 ZH/s on 9 Oct |
| Mining difficulty | 132.72T | No difficulty adjustment during the week |
| Hashprice (est.) | ~$39.3/PH/day | Miner revenue proxy; derived from difficulty and BTC price |
| Blocks found | ~1,064 (~152/day) | ~5.5% above the 1,008-block target; ~9.5-min average block time |
| BTC block subsidy mined | ~3,324 BTC/week | Blocks found × 3.125 BTC subsidy |
| Transaction fees (est.) | ~23 BTC/week | Estimated at ~0.7% of block subsidy |
| Estimated production cost | ~$54.7K/BTC | Illustrative: 18 J/TH and $0.06/kWh |
| Date | Day | Hashrate (EH/s) | Difficulty (T) | Blocks | Subsidy (BTC) | BTC mined |
|---|---|---|---|---|---|---|
| 04-Oct-26 | Sunday | 968 | 132.72 | 133.76 | 3.125 | 418.00 |
| 05-Oct-26 | Monday | 968 | 132.72 | 143.00 | 3.125 | 446.88 |
| 06-Oct-26 | Tuesday | 980 | 132.72 | 177.00 | 3.125 | 553.13 |
| 07-Oct-26 | Wednesday | 986 | 132.72 | 155.00 | 3.125 | 484.38 |
| 08-Oct-26 | Thursday | 998 | 132.72 | 154.00 | 3.125 | 481.25 |
| 09-Oct-26 | Friday | 1,000 | 132.72 | 146.00 | 3.125 | 456.25 |
| 10-Oct-26 | Saturday | 1,003 | 132.72 | 155.00 | 3.125 | 484.38 |
| Week | Total / avg. | 986 avg. | 132.72 | 1,063.77 | 3.125 | 3,324.27 |
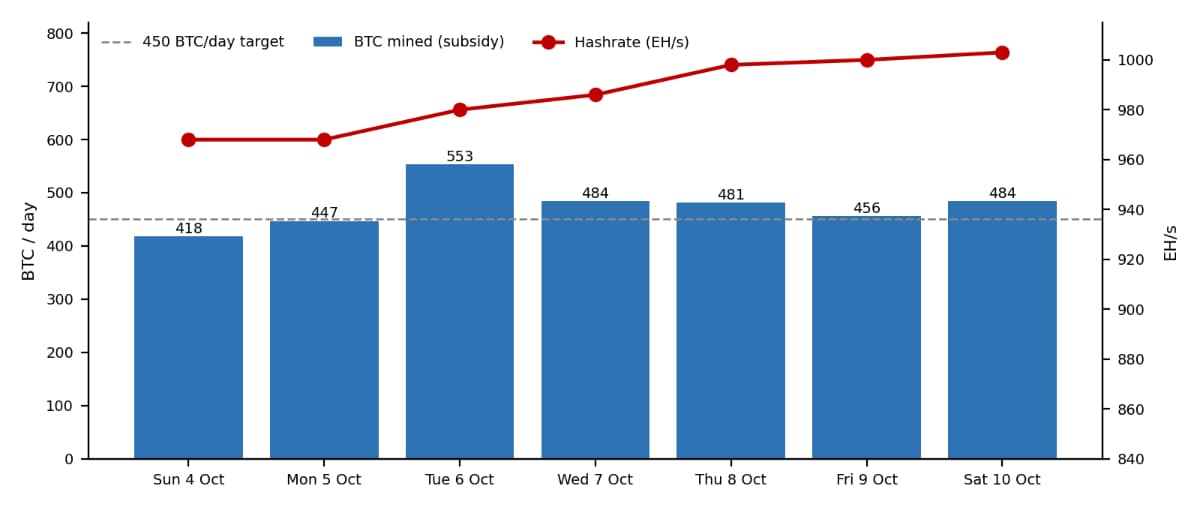
Daily BTC mined (bars) against network hashrate (line). The dashed line marks the 450 BTC/day theoretical output at 144 blocks/day.
Tuesday 6 October was the standout day, with 177 blocks and ~553 BTC mined, about 23% above the daily target. This reflects normal block-discovery variance on top of rising hashrate. Sunday and Monday were the only days below target (~418 BTC and ~447 BTC).
| Component | Weekly BTC | Approx. share of block subsidy |
|---|---|---|
| Block subsidy | ~3,324 BTC | 100% |
| Transaction fees (est.) | ~23 BTC | ~0.7% |
| Approx. USD value of subsidy | ~$274M | At ~$82.5K/BTC |
| Rank | Mining pool | Approx. hashrate | Approx. share |
|---|---|---|---|
| 1 | Foundry USA | ~256 EH/s | ~26% |
| 2 | AntPool | ~197 EH/s | ~20% |
| 3 | F2Pool | ~168 EH/s | ~17% |
| 4 | ViaBTC | ~89 EH/s | ~9% |
| 5 | SpiderPool | ~69 EH/s | ~7% |
The data for shares is from recent mempool.space block data (early October 2026). Hashrate is determined by applying each share to the ~986 EH/s weekly average. The top three pools account for more than 60% of the blocks.
| Rank | Country | Approx. share | Approx. hashrate |
|---|---|---|---|
| 1 | United States | 35.6% | ~351 EH/s |
| 2 | Russia | 18.1% | ~178 EH/s |
| 3 | China | 11.7% | ~115 EH/s |
| 4 | Paraguay | 4.8% | ~47 EH/s |
| 5 | Oman | 3.0% | ~30 EH/s |
Updated to the Hashrate Index Q4 2026 Global Hashrate Heatmap (published 5 Oct 2026). Oman replaced the UAE (now ~2.8%) at #5. Russia's share is the highest in the series, while the US share fell as some capacity shifted to AI data centres. Hashrate figures apply each share to the ~986 EH/s weekly average.
| Coin | Algorithm | Price | Difficulty | Network hashrate | Key mining characteristic |
|---|---|---|---|---|---|
| BTC | SHA-256 | $83,924.86 | 132.72T | 1,135 EH/s | Largest PoW network; halving-driven subsidy |
| ZEC | Equihash | $1,325.62 | 259.58M | 29.92 GH/s | Privacy-focused PoW asset |
| DOGE | Scrypt | $0.09 | 28.07M | 1.945 PH/s | High issuance; merged-mined with LTC |
| XMR | RandomX | $534.41 | 720.45B | 6.004 GH/s | CPU-friendly, ASIC-resistant privacy coin |
| BCH | SHA-256 | $287.15 | 474.40B | 3.209 EH/s | Shares SHA-256 mining ecosystem with BTC |
Source: minerstat.com/coins, early October 2026. Minerstat's BTC hashrate is a point-in-time estimate and is higher than the ~986 EH/s weekly average used elsewhere in this report. Monero (XMR) now replaces Litecoin (LTC, 2.301 PH/s), which fell to #6.
Difficulty increased by ~4.1% from the previous edition, which proportionally increases the production cost per BTC for any given fleet. Illustrative costs are calculated at 132.72T difficulty (power costs only):
| Scenario | Electricity | ASIC efficiency | Illustrative BTC cost |
|---|---|---|---|
| Efficient operation | $0.05/kWh | ~12 J/TH | ~$30K |
| Mid-case | $0.06/kWh | ~18 J/TH | ~$55K |
| Older fleet | $0.06/kWh | ~35 J/TH | ~$106K |
Using ~$82.5K BTC and ~$54.7K mid-case costs gives a gross spread of ~$27.8K/BTC, or ~34% of the BTC price. This is an increase from ~31% in the previous edition, as the increase in the BTC price outpaced the increase in difficulty. Older fleets at ~35 J/TH are still losing money at current prices. This is not a corporate net profit: costs of debt service, depreciation, hosting, staff, maintenance, SG&A, and financing are not included.
| Indicator | What to track each week |
|---|---|
| ASIC hashrate | TH/s per machine |
| Energy efficiency | J/TH |
| Power consumption | kW per machine |
| Revenue | BTC/US$ per day (≈0.000474 BTC per PH/s/day this week) |
| Electricity expense | US$/day at selected tariff |
| Gross mining margin | Revenue less electricity |
| ASIC payback | Months at current economics |
This week's rule of thumb: at ~$39.3/PH/day, an ASIC breaks even on electricity when the tariff × J/TH is below roughly 1.64 (for example, $0.06/kWh × 27 J/TH). Machines less efficient than ~27 J/TH are marginal at ~$0.06/kWh.
Sources: Hashrate Index network data (data.hashrateindex.com, 4–10 October 2026); Hashrate Index Q4 2026 Global Hashrate Heatmap (published 5 October 2026); mempool.(pool shares, early October 2026); minerstat.com/coins (PoW coin data, early October 2026).
India Crypto Research operates independently. The information presented herein is intended solely for educational and informational purposes and should not be construed as financial advice. Before making any financial decisions, it's essential to undertake your own thorough research and analysis. If you're uncertain about any financial matters, we strongly recommend seeking guidance from an impartial financial advisor.