The NVT Ratio
The Formula and a Worked Example
Understanding NVT
Why NVT Signal Smooths the Denominator
Adjusted Volume Calculation
NVT Similar to a Price-to-Earnings (P/E) Ratio
Where to Find NVT Data
What NVT Can't See
Indicators Worth Checking Alongside NVT
What This Means for Anyone Using NVT
FAQs

NVT divides Bitcoin's market value by the dollar value moving across its blockchain each day, asking whether the price is backed by real use.
It is compared to a P/E ratio because on-chain volume stands in for the earnings Bitcoin does not have.
A high or rising NVT means valuation is running ahead of activity, while a low or falling NVT means usage is catching up. The trend matters more than any single reading.
On 28 September 2026, Bitcoin was worth around $83,600. At that price, the value of the 20.09 million Bitcoins in circulation is roughly $1.68 trillion. While that figure represents what the market is willing to pay, it does not tell us how much the Bitcoin network is actually used.
That is where the NVT ratio comes into play.
NVT stands for Network Value to Transactions. It was created by analyst Willy Woo in February 2017. The idea behind the ratio is to evaluate whether the price of a Virtual Digital Asset (VDA, the Indian government’s legal term for crypto, tokens and NFTs) is justified by the economic activity, or transactions, that it facilitates. Bitcoin is a VDA, and as such, the ratio can be used to evaluate it.
Bitcoin plays two roles at once. It is a store of value, captured by market cap, and a settlement network, captured by how much value moves across it. NVT puts the two side by side. Technically, it is the inverse of monetary velocity, which is how quickly money circulates.
NVT = Market Cap ÷ Daily On-Chain Transaction Volume
NVT takes the market capitalisation of a VDA, which is price multiplied by coins in circulation, and divides it by the total value of all on-chain transactions between separate owners in a given period (usually a day).
Using the example above, where the market capitalisation of Bitcoin was $1.68 trillion, and pairing it with daily on-chain transactions of $12 billion, the NVT would be 140. This means that every $140 of Bitcoin’s market capitalisation is supported by $1 of daily on-chain transactions.
If the daily on-chain transactions of Bitcoin increase to $24 billion at the same price, the NVT ratio would fall to 70. Same valuation, twice the activity behind it.
The market cap figure is from Bybit as of 28 September 2026. Both volume figures are hypothetical and used only to show the arithmetic.
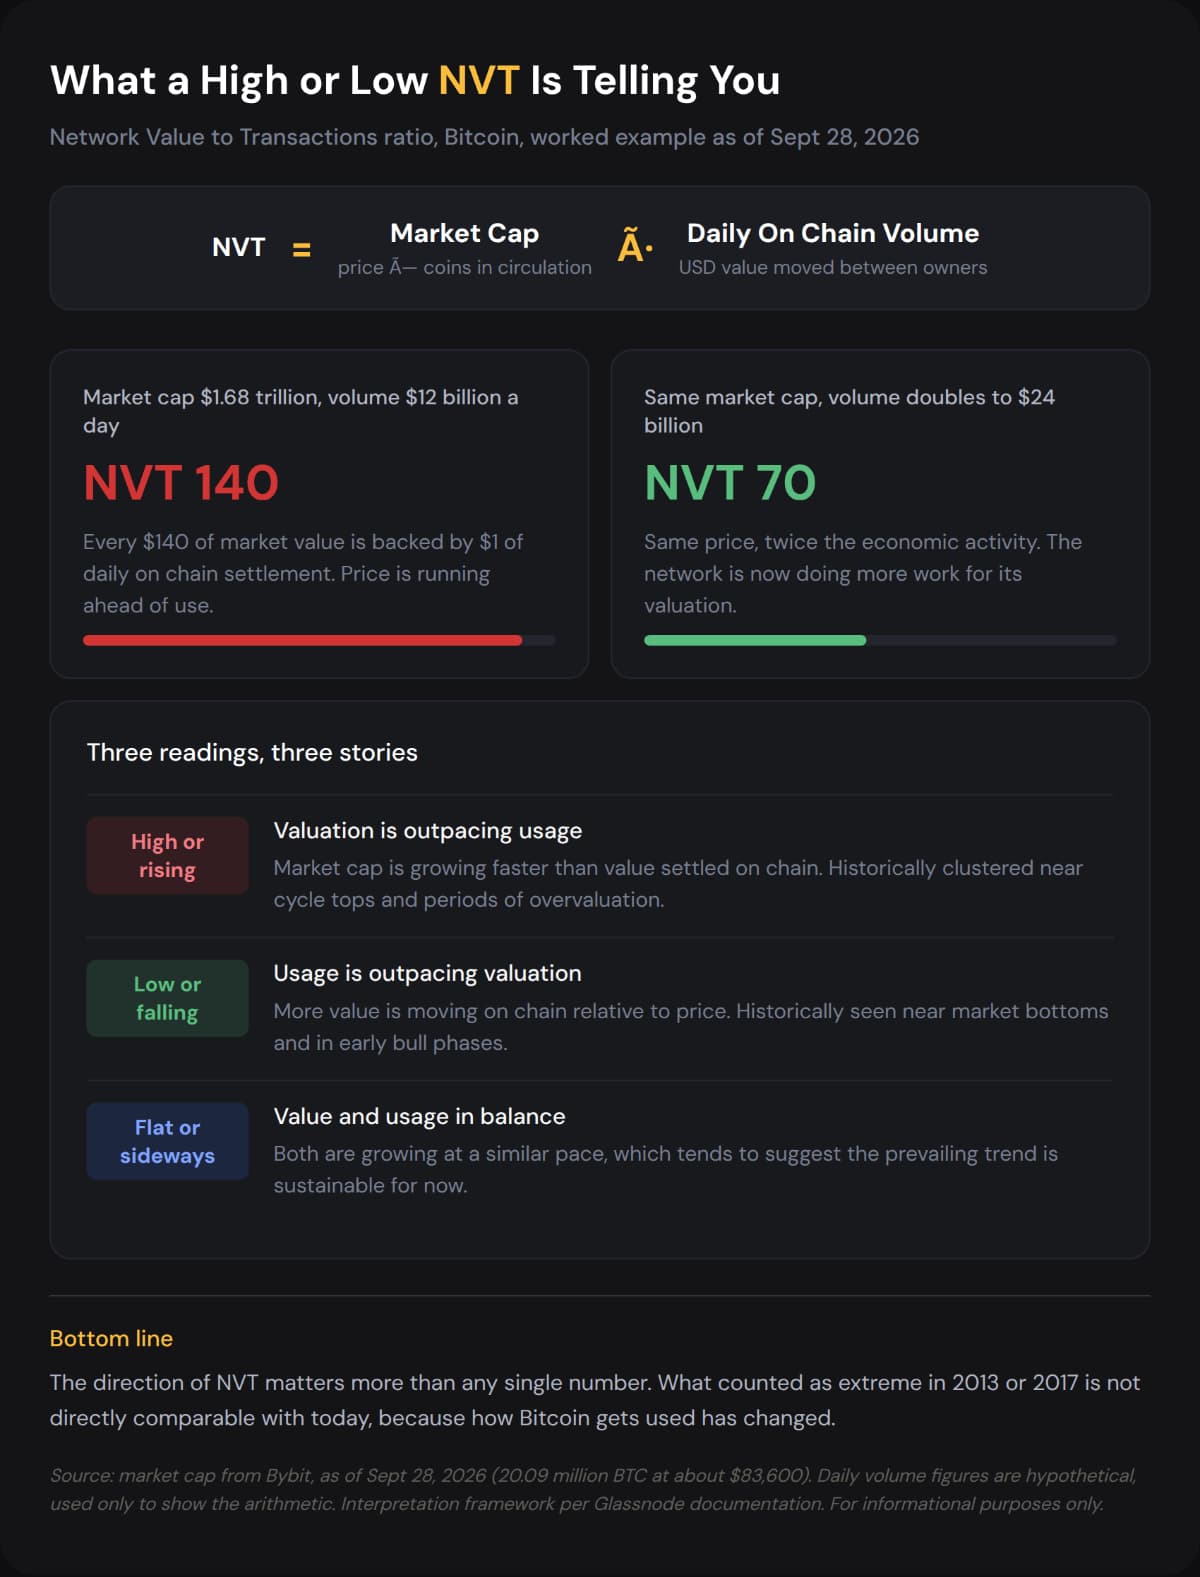
What a high or low NVT is telling you
When NVT is high or rising, it means investors are paying a premium, with market cap growing faster than the value settled on-chain. According to Glassnode, high readings have historically coincided with market tops.
A low or falling NVT has historically lined up with market bottoms or early bull phases. A flat NVT suggests market cap and on-chain activity are growing in step.
It is worth noting that Bitcoin's usage has changed sharply since 2013. More BTC is held in long-term storage, and more payments happen off the main chain. Glassnode notes that NVT values from different cycles are not directly comparable, and recommends focusing on the trend rather than the absolute level.
The on-chain volume for Bitcoin is somewhat irregular. A single large on-chain transfer can halve the NVT for that day.
Woo's original version smoothed this with a 28-day moving average centred on each date. However, this used future values, so a top could only be confirmed after the fact.
In February 2018, Cryptolab Capital's Dmitry Kalichkin divided each day's market cap by a 90-day trailing average of daily volume instead. He argued that crypto is reflexive, meaning short-term price moves drag activity along with them, so a longer window better reflects long-term economic activity.
The result, called NVT Signal or NVTS, behaves like an oscillator with readable highs and lows.
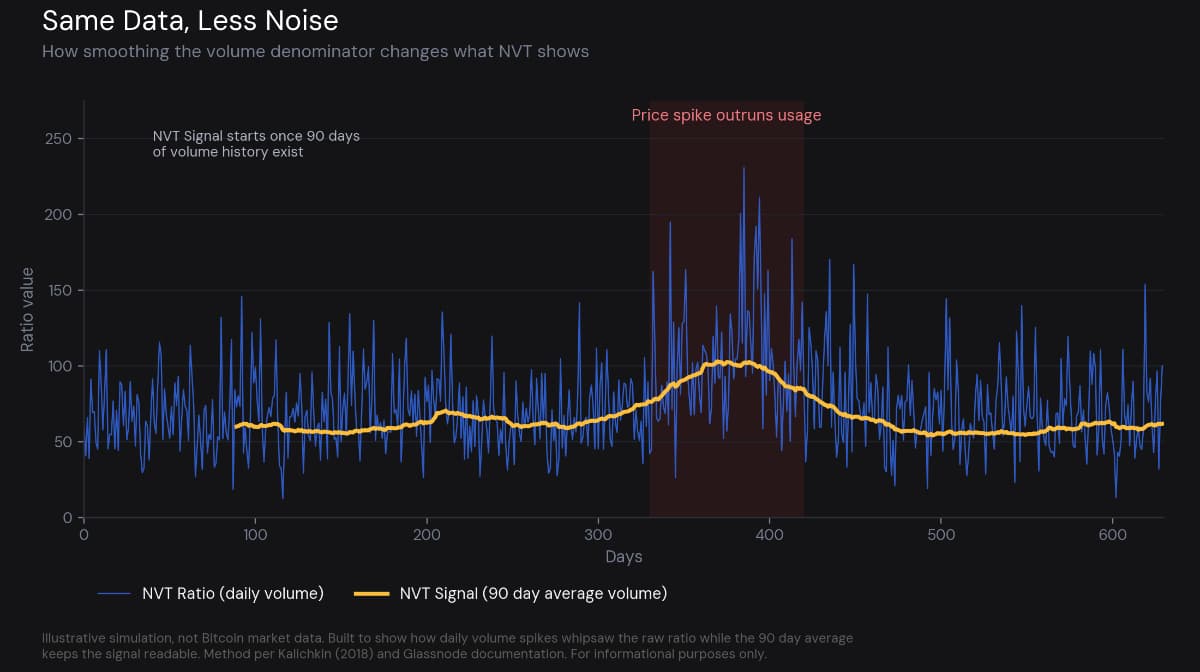
Same data, less noise: raw NVT versus NVT Signal
Not every coin that moves on-chain changes, owner. In Bitcoin's UTXO (Unspent Transaction Output) model, coins are spent as whole chunks, and any leftover returns to the sender as change. If a transaction spends a 2 BTC output and sends 0.5 BTC to another address, the remaining 1.5 BTC returns to the sender. To the blockchain, the entire 2 BTC output is spent. Therefore, the blockchain shows that 2 BTC moved, even though only 0.5 BTC reached someone else.
Transfer volumes can be adjusted to remove transfers that do not change ownership. Coin Metrics' Adjusted Transfer Value, for example, removes transfers sent back to the sender, likely change outputs, and transfers between an exchange's cold wallets.
Glassnode's entity-adjusted volume goes further by grouping addresses it believes are owned by the same entity. Because providers clean volume differently, their NVT readings for the same day can differ, so always check which volume a chart uses.
The P/E ratio shows the price of a stock relative to the profit it earns. Let's say stock X earns a profit of ₹50 per share in a year, and the stock is listed at ₹1,000. The P/E ratio of stock X is 20. Investors are paying ₹20 for every ₹1 of yearly profit, or roughly 20 years of today's profits to earn back the price. A P/E far above similar companies suggests investors expect fast growth, or are simply paying too much.
Bitcoin doesn't have an earnings component, so the P/E ratio can't be used directly. However, Woo (2017) suggested using the value of payments made by users of the Bitcoin network as an analogue to earnings. In this case, market capitalisation replaces the share price, and earnings are replaced by the daily volume of on-chain payments.
The question stays the same: how much are buyers paying for each dollar of real work the network does? A low NVT would suggest Bitcoin is cheaply priced, similar to a stock with a low P/E ratio. A high NVT would suggest Bitcoin is stretched, like a stock with a high P/E ratio.
There are limitations to NVT. Company earnings are audited and belong to shareholders. On-chain volume is an estimate that varies by provider, and it is activity, not income paid to holders. NVT borrows the idea behind a P/E ratio, not its precision.
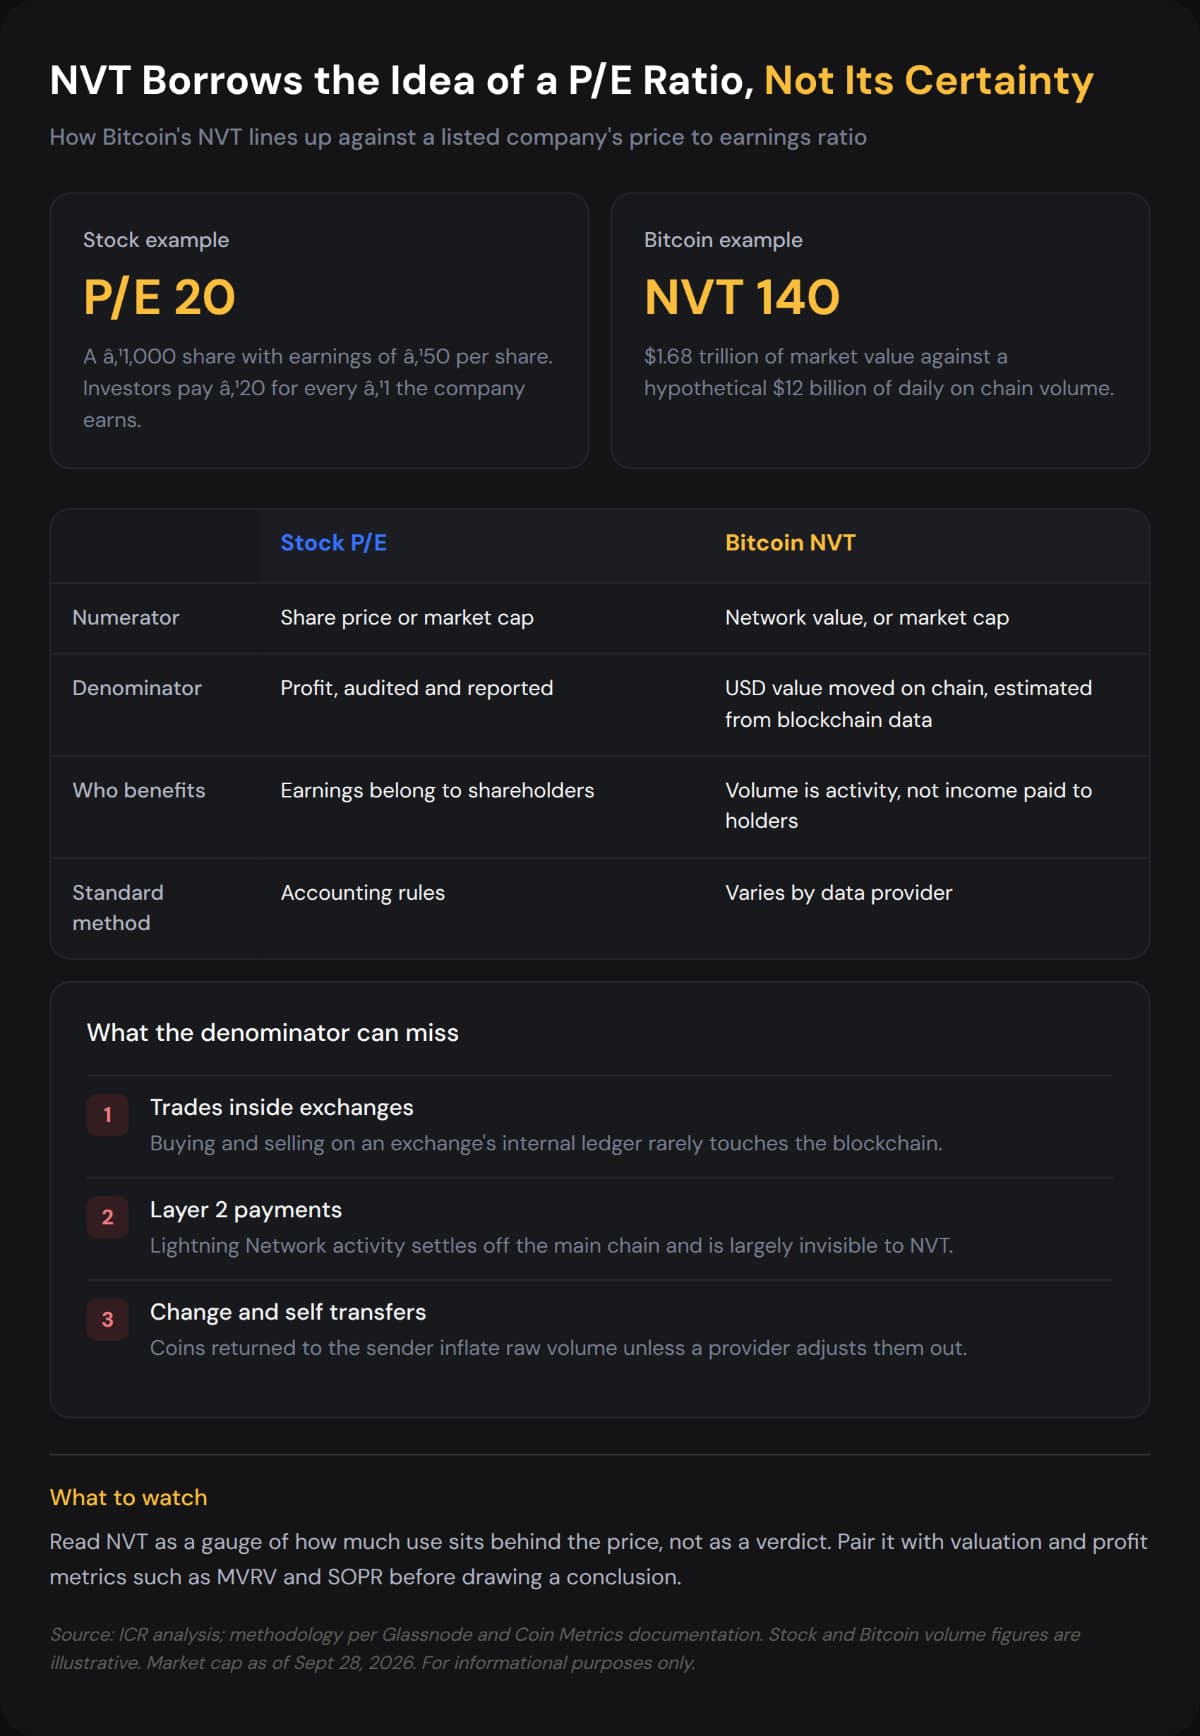
NVT borrows the idea of a P/E ratio, not its certainty
Several providers publish NVT data, each with its own volume basis. Some of the detailed series sit behind paid subscriptions.
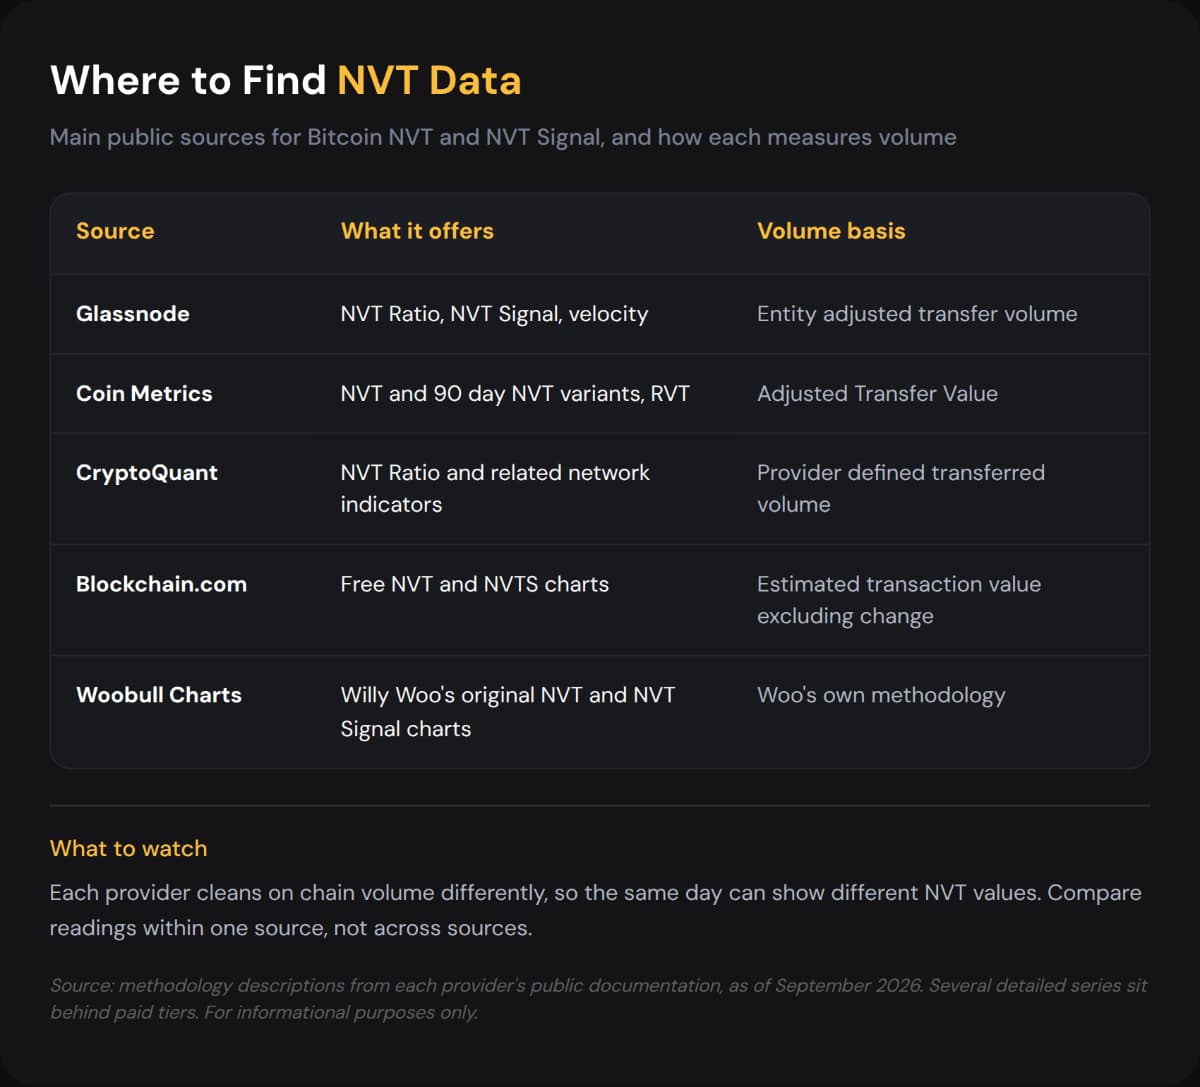
Methodology descriptions from each provider's public documentation, as of September 2026.
NVT has a major blind spot in its denominator. Trades on centralised exchanges mostly settle on their internal ledgers and never appear on the blockchain. Payments on the Lightning Network also settle off the main Bitcoin network. Lastly, shares of a spot Bitcoin ETF are traded on a stock exchange, while the underlying Bitcoin only moves when shares are created or redeemed.
Each of these pushes measured on-chain volume down over time, which lifts NVT's baseline. That doesn't mean Bitcoin has entered overvalued territory. Volume can also be inflated cheaply by a large holder moving coins to themselves. For low-volume, low-cap tokens, this can easily distort NVT.
MVRV (Market Value to Realised Value) compares market cap with realised cap, the value of every coin at the price it last moved on-chain. It shows how far the market sits above what holders collectively paid.
RVT (Realised Value to Transactions) swaps market cap for realised cap in the NVT formula, giving a slower, longer-term signal that is less swayed by daily sentiment.
SOPR (Spent Output Profit Ratio) indicates whether coins moving today are, on average, being sold at a profit or a loss.
Exchange flows indicate the general direction of funds. Flows out of an exchange usually mean coins are moving into self-custody to be held, not sold. Flows into an exchange often indicate an intent to sell.
When these indicators point the same way as NVT, the reading carries more weight. When they disagree, that disagreement is itself the finding.
A rising NVT indicates price may be outpacing use, and a falling NVT means use may be outpacing recognition. Neither indicates when a top or bottom will occur. In this regard, treat NVT as a question, not a trading signal.
In practice, check which volume a chart uses, prefer NVT Signal over the raw daily ratio, compare readings only within similar market phases, and confirm any signal against MVRV, SOPR and exchange flows.
For readers in India, changes to valuation signals will not impact taxation. Profits from VDAs are taxed at a flat 30% plus a 4% cess, with a TDS of 1% on transfers. Losses cannot be set off against other gains. These provisions sit in Section 115BBH and Section 194S of the Income-tax Act, 1961, and the new Income-tax Act, 2025 governs transactions from 1 April 2026. It is advisable to approach a chartered accountant for clarity on the current tax laws before preparing your income tax return.
NVT will not give you the fair market value of Bitcoin. It will, however, give you a good idea of the real economic activity standing behind a given Bitcoin price.
India Crypto Research operates independently. The information presented herein is intended solely for educational and informational purposes and should not be construed as financial advice. Before making any financial decisions, it's essential to undertake your own thorough research and analysis. If you're uncertain about any financial matters, we strongly recommend seeking guidance from an impartial financial advisor.