This week in one minute
Where did the ETF money go?
Who sold and who bought?
Is leverage being used?
What are options traders looking for?
Macro was not friendly
The network continues to grow
Where are the key levels?
What this means for Indian readers
What's still to come
FAQs

Bitcoin closed at $86,480 (about ₹83 lakh), up 2.4%, for its fourth straight weekly gain.
ETF buying collapsed 90% to $241 million, with one day of outflows. Last week it was $2.39 billion.
Long-term holders sold into strength for the first time in weeks, cutting 26,000 coins.
About 79% of all Bitcoin is now in profit, up from 73.5%.

 Part of a series
Two weeks ago, price recovered without any buyers. Last week buyers came in with $2.39B. This week, buyers held their money back and price kept going up.
That's the puzzle in this issue. Demand through the funds nearly vanished. Long-term holders started selling. And Bitcoin still added 2.4%.
1. Price closed the week at $86,480, adding 2.4% for the week. That's the fourth week in a row of gains but the previous two were larger.
2. Inflows into Bitcoin ETFs fell 90% to $241M. Thursday was an outflow day, led by Fidelity.
3. Long-term holders sold 26,000 BTC. The patient holders turned seller as price went up.
4. 79% of the supply is in profit. More coins above water means more potential sellers.
5. The hash rate hit another all-time high at 962 EH/s. Miners keep expanding capacity, regardless of price.
About $2.39B came in over the course of a week, then not much after.
US spot Bitcoin ETFs took in a net $241M from 28 September to 2 October, a 90% drop from the previous week. On 30 September, the funds lost $149M in a single day, mostly from Fidelity. The following Monday was an outflow day as well.
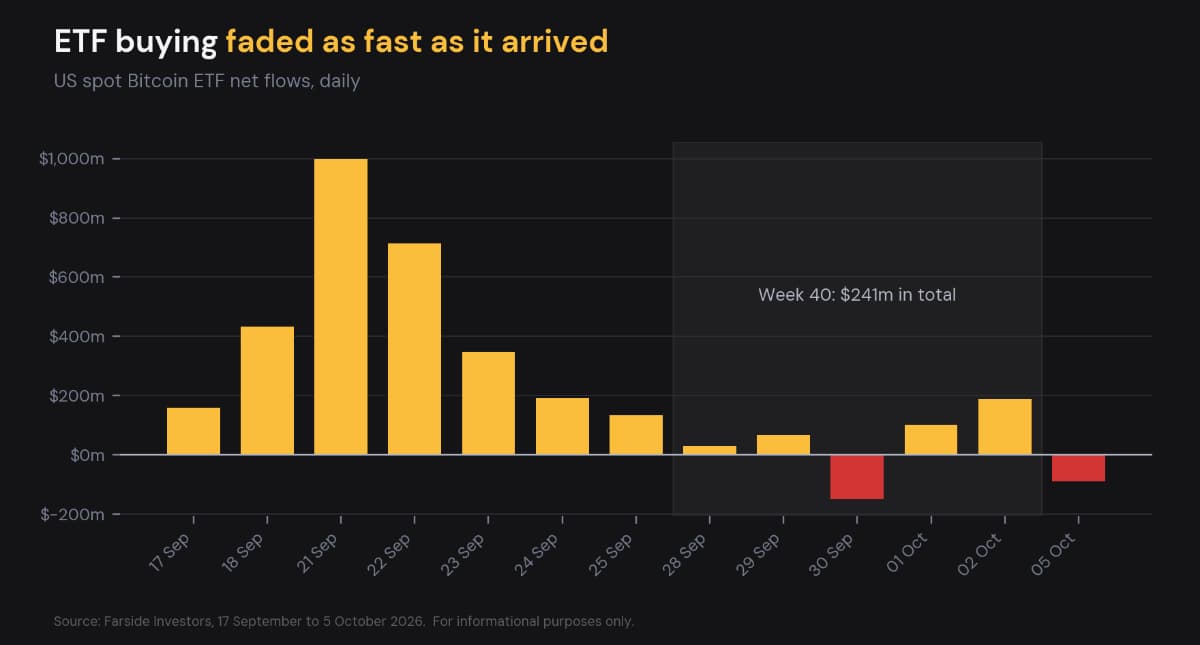
Daily US spot Bitcoin ETF net flows, September to October 2026
Not much cash on the sideline moved either. Stablecoin supply rose about $2B to $313.7B. Realized Cap, which rises when coins change hands at a higher price, added only $1.7B, compared to $6B the week prior.
What kept happening was quiet drain from exchanges. Balances fell to 2.681 million Bitcoin, and 430 coins were drained on 4 October. So, coins continued to move into private wallets; it’s just that the fund buying from last week stopped.
By the Numbers Spot ETF net flows +$241 million (from +$2,386 million). Exchange balance: 2.681 million BTC. |
What this means for readers: This was just one strong week of buying by funds. Watch if this buying recovers to a couple hundred million a week. If it doesn’t, this looks stronger than it really is.
For the first time in weeks, long term holders started selling this week. Long term holder supply (coins held for > roughly 155 days) reduced from 14.581 million to 14.555 million. About 26,000 coins moved from long term holder supply to short term holder supply. Just a week prior the opposite was happening.
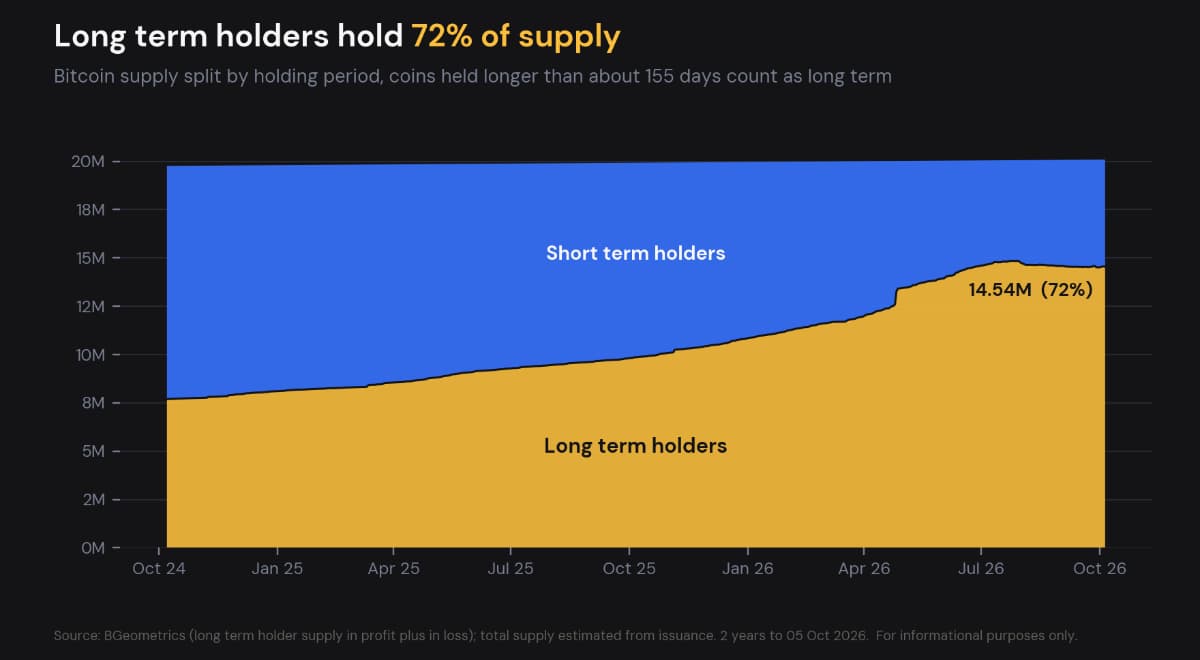
Bitcoin supply split between long-term and short-term holders
Why the shift? The supply in profit rose from 73.5% to 78.7%. MVRV rose to 1.61, so the market is 61% above the average price holders paid. NUPL was 0.379, and is in the so-called optimism zone.
SOPR, which measures whether moving coins are sold at a profit, eased from 1.0195 to 1.0043. Selling less aggressively meant that selling pressure was less, even as more coins moved into profit. This selling pressure was measured, and not a panic sell-off.
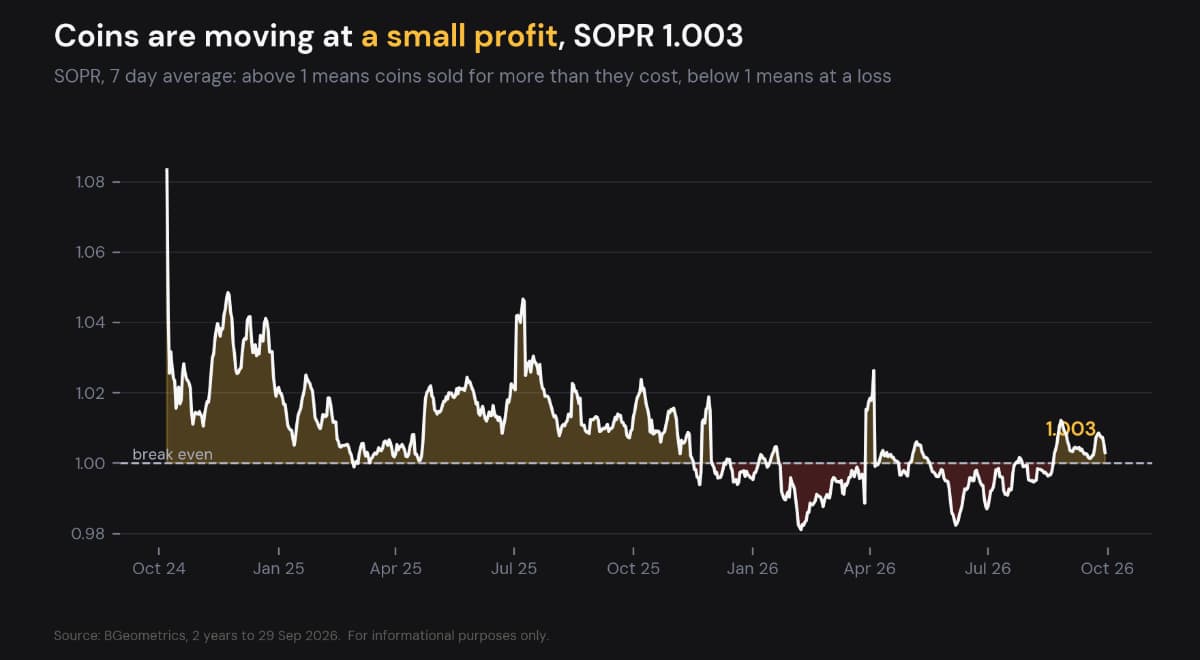
SOPR, 7-day average, showing whether coins move at a profit or a loss
By the Numbers Long-term holder supply 14.555 million BTC (from 14.581 million last week). Supply in profit 78.7% (from 73.5% last week). |
What this means for readers: With 78.7% of the supply in profit, coins build up for sale. This is a natural mid-cycle pattern of patient holders selling coins to more recently purchased, and, thus, less patient buyers. This only gets concerning if the demand for coins remains low.
The total value of open interest in Bitcoin futures increased by 4.5% to $55.1 billion, about in line with the increase in the price of Bitcoin. Thus traders were in sync with the market, not aggressively pursuing trades. Cheap funding of 0.0038% every 8 hours was well under the 0.01% baseline. Total liquidations fell to $86 million of longs and $129 million of shorts, from $106 million and $224 million last week.
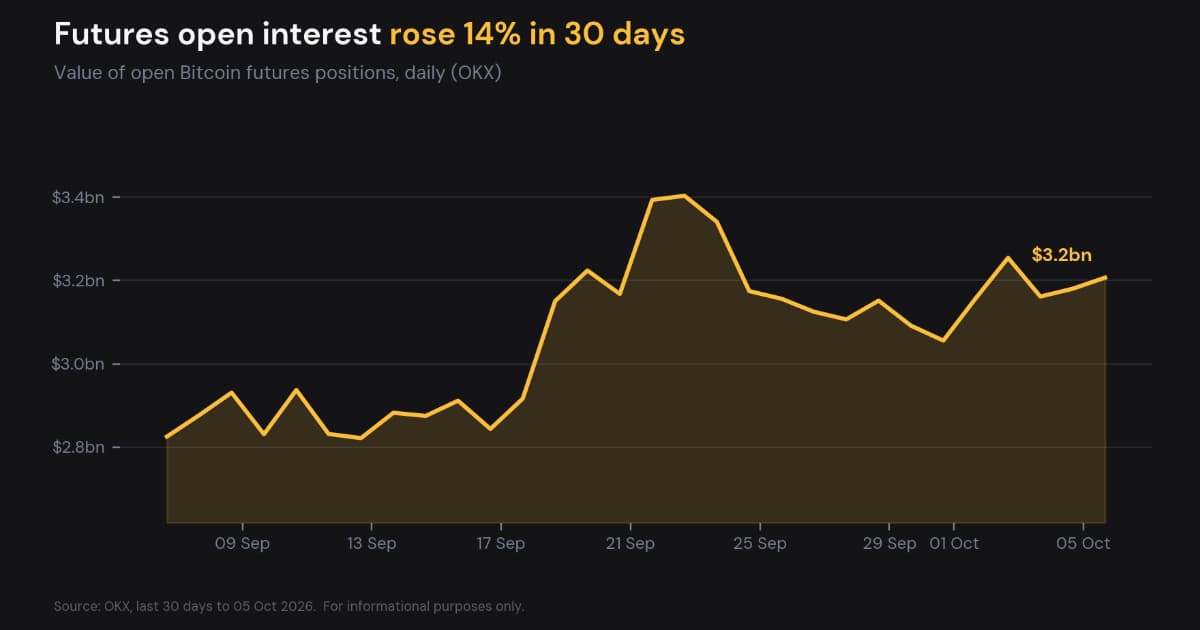
Bitcoin futures open interest over the last 30 days

Bitcoin perpetual futures funding rate over the last 30 days
What this means for readers: Calm derivatives markets mean no crowded trades are waiting to be unwound, but also no large squeeze orders are waiting to push the price even higher.
The 1 week 25 delta skew fell from 1.19 to -0.18, meaning it is slightly more expensive to buy calls than puts. Traders were paying a premium to protect their position last week. This week, there was less concern. Implied volatility fell to 32.2%, one of the more calm levels for the quarter, and options open interest rose to $30.5 billion after the quarterly expiry.
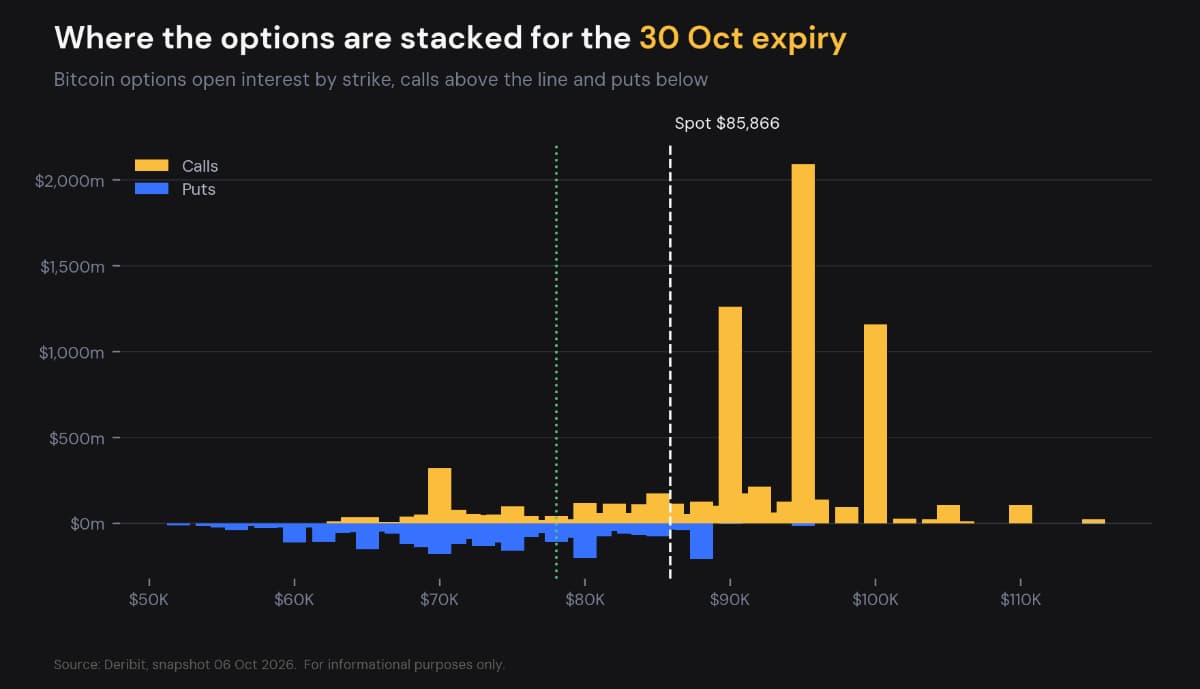
Bitcoin options open interest by strike for the next major expiry
The ‘max pain’ level for the next major options expiration moved up from $74,000 to $78,000 as the price moved up. The nearest heavy block of call options is at $90,000.
What this means for readers: Volatility is down, and options are cheap. This is a cheap time to buy options and hedge your Bitcoin position.
The target range for the Fed Funds rate was left at 3.75 to 4%, with core inflation holding steady at 2.45%, leaving the real policy rate at 1.55%. The 10 year treasury yield rose to 5.28%, and the dollar index strengthened to 101.93. Both typically move against Bitcoin.
What this means for readers: The results of the latest Fed meeting showed no materially new information. While yields rose, ETF inflows remained weak, meaning this pressure could show up first if ETF inflows stay weak.
The average hash rate reached a new high of 962.5 EH/s, and miners made $270.5 million. Daily active addresses reached a new high of 471,069. Transactions held steady near 655,000. Fees reached $2.02 million for the week, which is less than 1% of miner revenue.
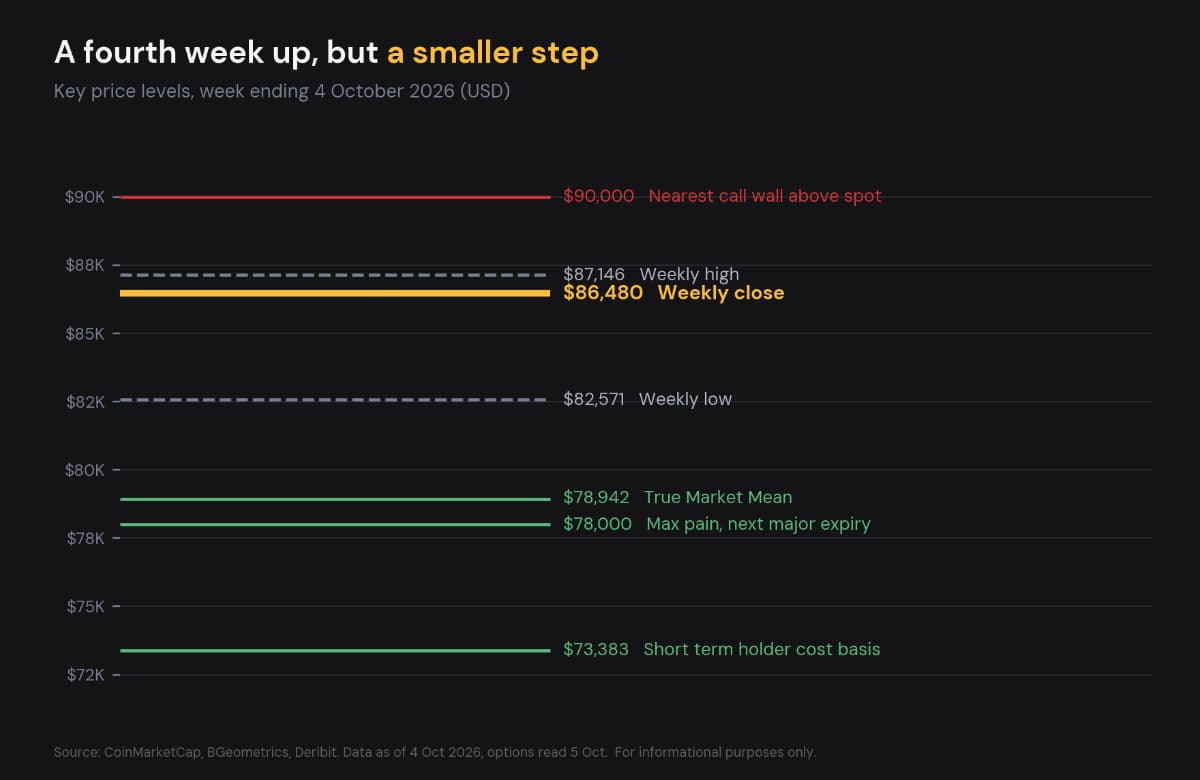
Key Bitcoin price levels for the week ending 4 October 2026
| Level | Price | Why it matters |
|---|---|---|
| Resistance | $90,000 | Nearest heavy block of call options above spot |
| Weekly high | $87,146 | Capped twice now, after $87,364 on 23 September |
| Weekly close | $86,480 | |
| Support 1 | $82,571 | Last week's low |
| Support 2 | $78,942 | True Market Mean, with max pain at $78,000 just below |
| Support 3 | $73,383 | Short-term holder cost basis, up from $72,763 |
| Scenario | Trigger | Next level |
|---|---|---|
| Bull case | A close above $87,364 with ETF inflows returning | $90,000 and the call wall |
| Base case | Price holds between $82,571 and $87,364 on light leverage | Range while flows are tested |
| Bear case | Weekly close under $78,942 | $78,000 max pain, then $73,383 |
In rupee terms, Bitcoin ended near ₹83 lakh at around ₹96 to the dollar. A stronger dollar can cause a slightly weaker rupee. So an Indian investor could have seen slightly higher than 2.4%.
There's still no tax change. Gains from VDAs (which includes crypto, tokens and NFTs) are taxed at 30% plus 4% cess, with the exchange taking off 1% TDS for transfers. The Budget 2026 did not change these taxes. The Income-tax Act, 2025 governs transactions from April 1, 2026. There is no loss set off against gains.
PRACTICAL NOTE: 79% of all supply in profit means many Indian buyers who entered in the spring are now in the money. Don’t forget that a sell triggers the 30% tax on the gain. The exchange also withholds 1% TDS on the sale amount. That TDS is credited towards your final tax liability, however your after-tax amount is less than what is shown on your screen.
Corporate treasury purchases and the treasury average entry remain absent for the third week in a row. Glassnode hasn’t released anything on these and remains the only source of this information. The last read, for Week 37, was at a value of $80,500 and is now less than current market price.
Sources and dates. Price, market cap and dominance from CoinMarketCap (daily closes, 28 September to 4 October 2026). Network activity, fees and miner revenue from Token Terminal. Cost basis, holder supply, SOPR and Realised Cap from BGeometrics (4 October). Hash rate and difficulty from mempool.space. ETF flows from Farside Investors (28 September to 2 October). Macro from the Federal Reserve, FRED and Yahoo Finance. Options from Deribit and futures open interest from CoinGlass (read 5 October). Funding from OKX. Exchange balance read 5 October and net flow for 4 October, from CryptoQuant. Rupee rate is approximate. Weekly changes are shown only where both weeks use the same source.
India Crypto Research operates independently. The information presented herein is intended solely for educational and informational purposes and should not be construed as financial advice. Before making any financial decisions, it's essential to undertake your own thorough research and analysis. If you're uncertain about any financial matters, we strongly recommend seeking guidance from an impartial financial advisor.