
This week's news in less than 60 seconds
What caused Bitcoin to surge?
Why isn't the rally showing up in leverage?
So why are traders buying protection?
Some profit taking
Tightening macro conditions, Bitcoin rally
Updates on the network
Where are the key levels?
What this means for Indian readers
Other developments
FAQs

Bitcoin closed the week at $84,458 (about ₹81 lakh), up 4.1%, with a high of $87,364.
Spot ETFs took in $2.39 billion after the weakest week on record. Monday alone brought in $999 million.
Futures open interest fell 14% to $52.7 billion and funding more than halved. This rally was bought with cash, not borrowed money.
Options traders are paying up for protection even as price climbs. Puts now cost more than calls.

Last week, the price of Bitcoin recovered, but the flow behind it remained stagnant. Seven days later, that flow returned. US spot Bitcoin ETFs bought Bitcoin worth $2.39 billion. As a result, the spot price of Bitcoin increased by 4.1% and reached $84,458. Additionally, more Bitcoins were withdrawn from exchanges.
The rest of the market, however, reacted oddly. Leverage shrank, and traders paid more for downside protection than for upside.
1. ETF inflows jumped to $2.39 billion. The US spot Bitcoin ETFs took in $2.39 billion, up from $6.2 million a week earlier, the sharpest turn since their inception.
2. Price closed at $84,458, up 4.1%. All cost basis levels are currently well below the market.
3. Futures open interest fell 14%. Positions were cut while price rose, so the move wasn't built on leverage.
4. Puts turned more expensive than calls. Despite the rising price of Bitcoin, more traders bought downside insurance.
5. Hash rate hit a record. The hash rate of the Bitcoin network reached a new high of 943 EH/s.
US spot Bitcoin ETFs amassed $2.39 billion worth of Bitcoin from September 21st to 25th. Monday alone brought in $999 million, more than the previous six weeks combined. According to Glassnode, using a slightly different weekly window, the inflow jumped 368%, well above its high band.
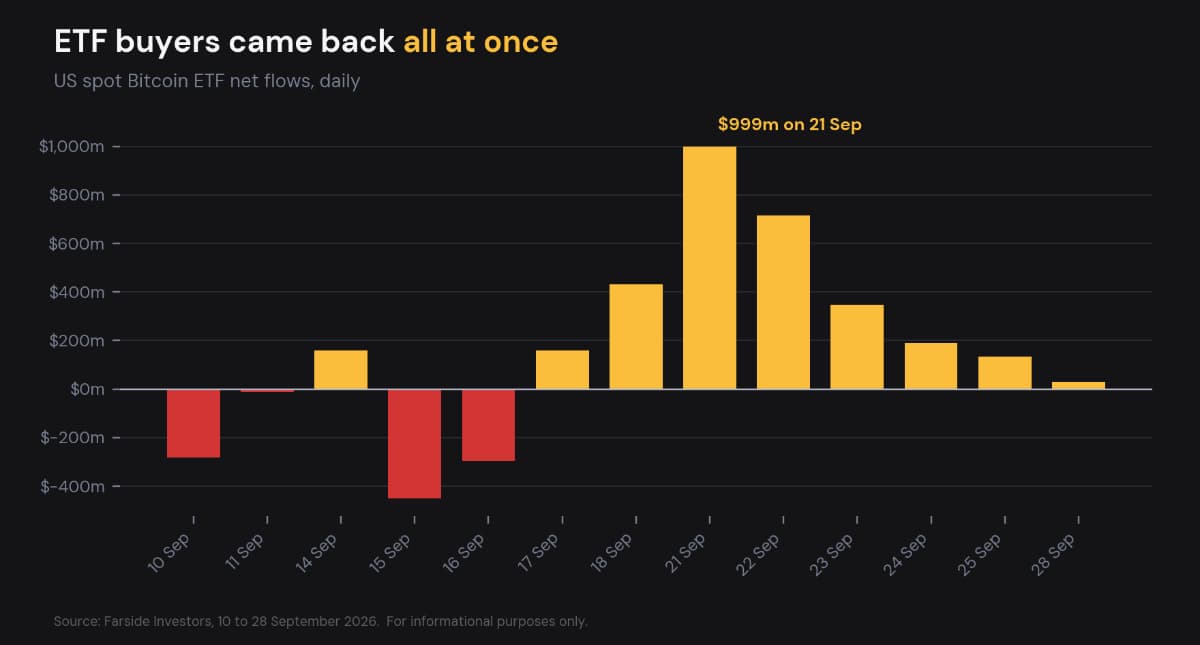
Daily US spot Bitcoin ETF net flows through September 2026
Other data points support the idea that fresh professional money is flowing into Bitcoin. The Realised Cap, which tracks the value of Bitcoin based on when it last moved, added about $6 billion. This is often seen with new demand. Additionally, about 22,000 Bitcoin left exchanges over the week, and the number of Bitcoin on exchanges decreased to 2.685 million from 2.707 million.
One piece of data contradicts the belief that new money is flowing into Bitcoin. The amount of stablecoins in circulation, which is typically used by investors to buy Bitcoin, did not change and was reported at $311.7 billion.
It is likely that new money is flowing into Bitcoin through regulated funds, not from crypto traders putting their sidelined cash to work.
By the Numbers Spot ETF net flows plus $2,386 million (from plus $6 million). Exchange balance: 2.685 million BTC (from 2.707 million). |
What this means for readers: Demand is now clearly institutional. Watch whether ETF inflows stay in the hundreds of millions a week. One strong week can be rebalancing. A second one confirms a trend.
Futures positions shrank while the price rose, which is rare and healthy. Futures open interest fell to $52.7 billion from $61.3 billion, a 14% drop. Funding, the fee buyers of perpetual futures pay to stay long, more than halved to 0.003% every 8 hours, less than a third of the usual baseline. Short sellers took the damage: $224 million of shorts were liquidated against $106 million of longs.
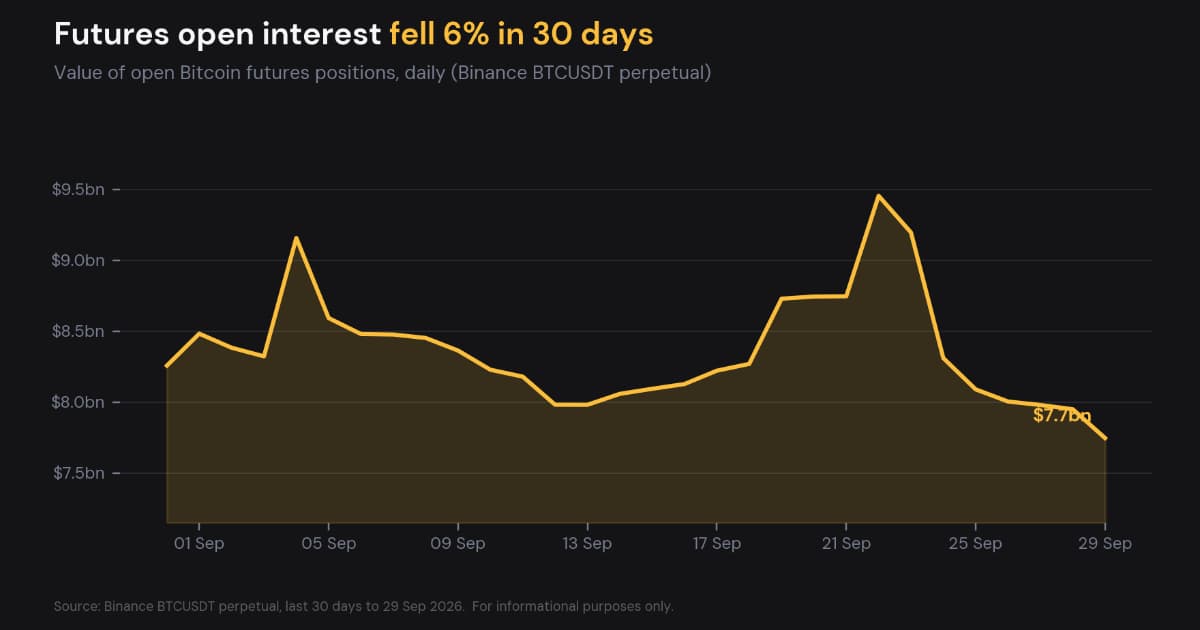
Bitcoin futures open interest over the last 30 days
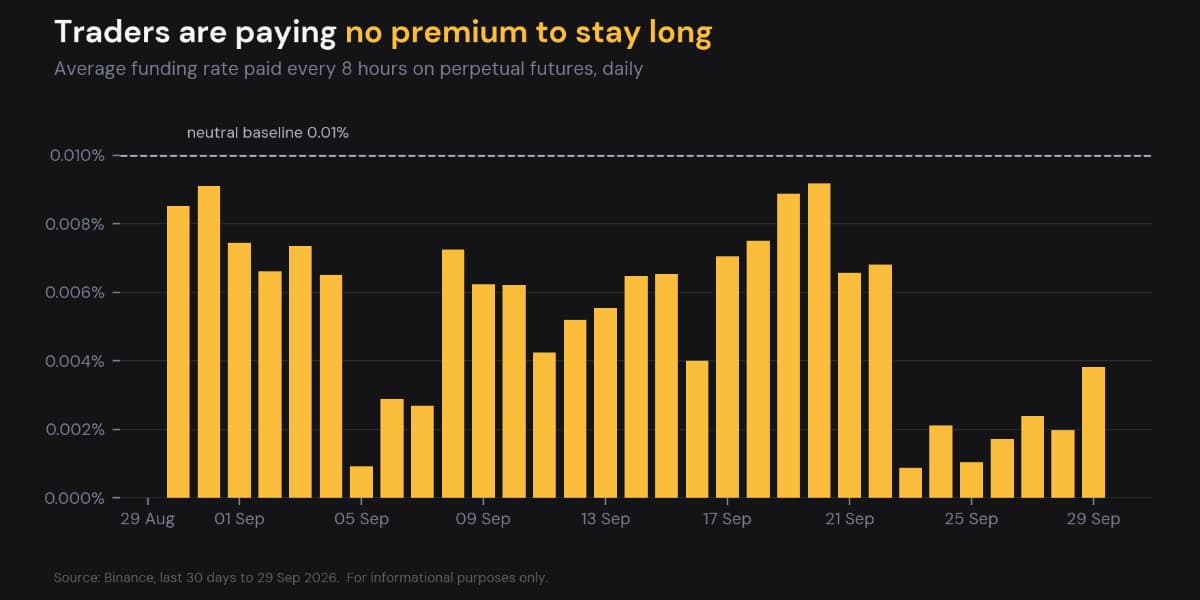
Bitcoin perpetual futures funding rate over the last 30 days
Part of the drop is mechanical. Friday's quarterly options expiry cleared $14.4 billion in contracts, and options open interest fell by $12.7 billion, from $42.5 billion to $29.8 billion. But futures were cut too, and funding stayed cheap.
By the Numbers Futures open interest fell to $52.7 billion from $61.3 billion. Liquidations were $106 million long and $224 million short. |
What this means for readers: A rally funded by spot buying is more durable than one funded by borrowing, because there are fewer forced sellers when the price falls. The flip side is that there is no leverage squeeze waiting to push the price higher.
The one-week 25-delta skew, which compares the price of puts and calls at equal distance from spot, moved from minus 0.81 to plus 1.19. A week ago, calls were more expensive. Now puts are. The implied volatility for Bitcoin has decreased from 36.9% to 33.4%, so the market is calm, just cautious.
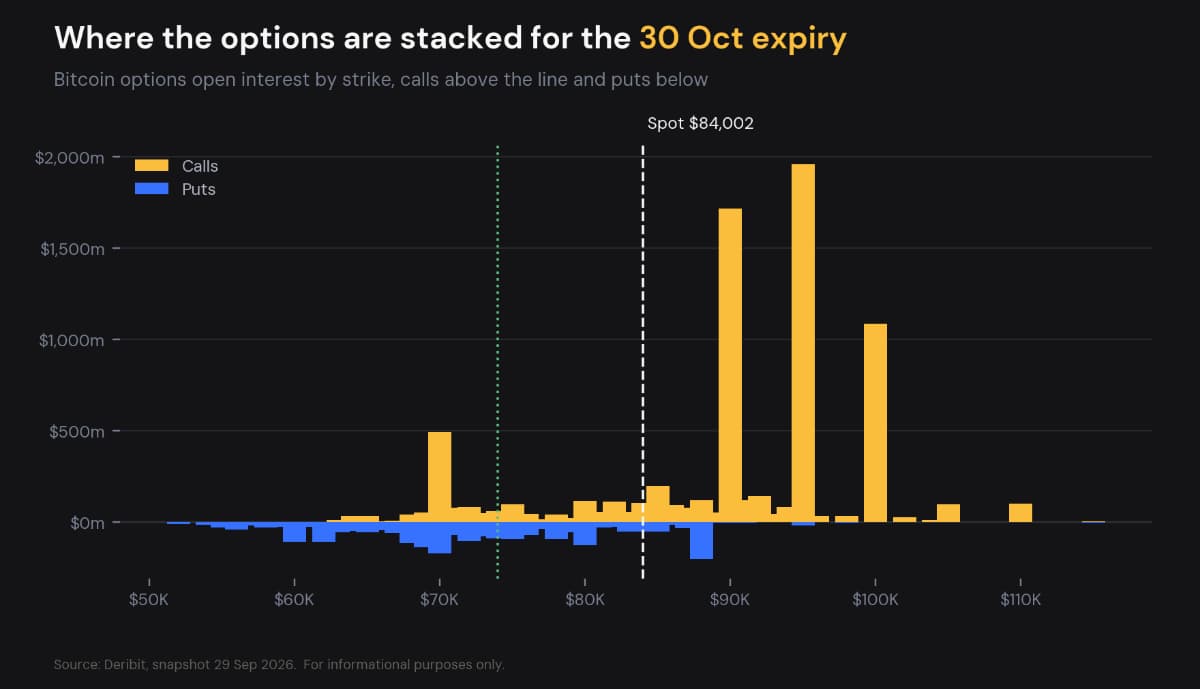
Bitcoin options open interest by strike for the next major expiry
Also, max pain, the price at which the most options expire worthless, has increased to $74,000, about 12% below the market. Notably, large amounts of open interest are located below the current spot price.
What this means for readers: Hedging into strength is what large holders do when they want to keep exposure without taking the full drawdown. It is caution, not a bearish signal.
SOPR (spent output profit ratio) rose from 1.002 to 1.020. So, on average, outgoing transactions were conducted at a 2% profit. Previously, coins moved at break-even. MVRV (market value to realised value) and NUPL (net unrealised profit/loss) rose to 1.57 and 0.37, respectively. Thus, the market is valued 57% above the average price holders paid, and 37% of its value is paper gains. The share of Bitcoin supply in profit rose to 73.5% from 72%.
Long-term holders, wallets that have held for more than roughly 155 days, still increased their holdings. Their supply increased to 14.581 million BTC from 14.544 million BTC. Some short-term traders sold into strength while patient holders kept accumulating.
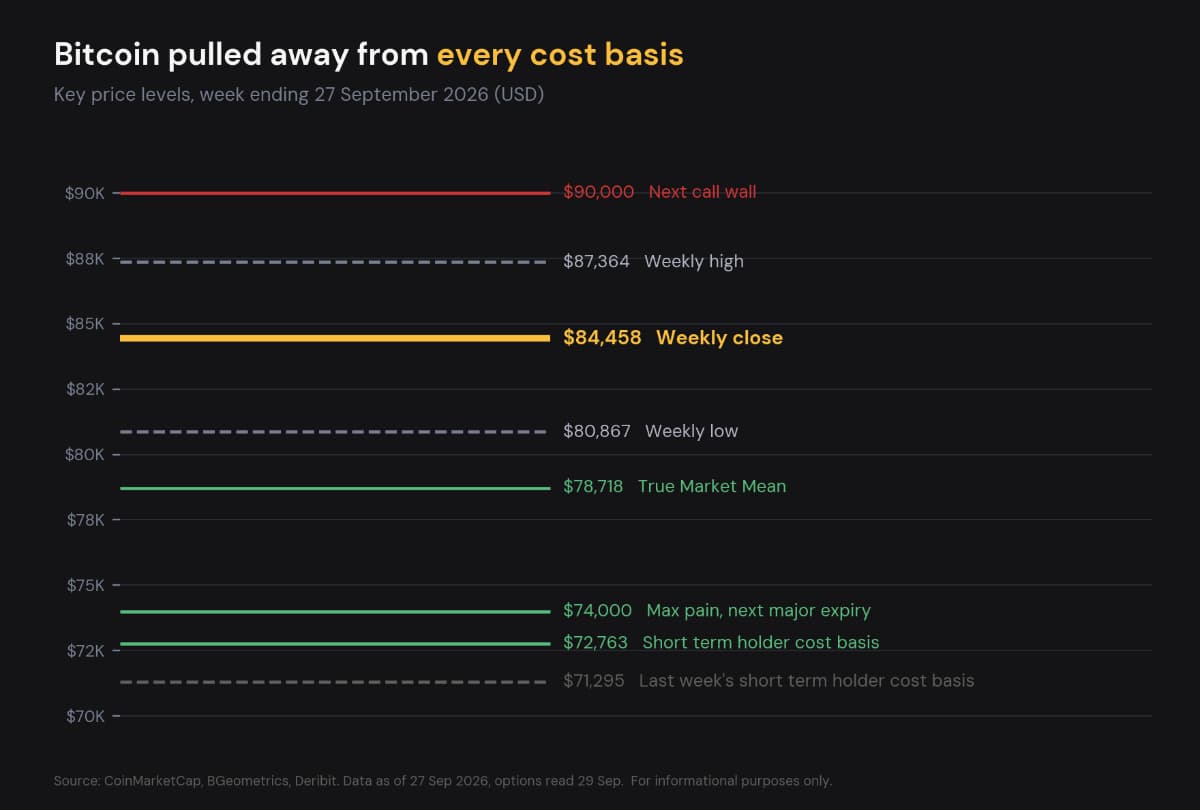
Key Bitcoin price levels for the week ending 27 September 2026
What this means for the average investor: Profit taking at these levels is normal and should not be of concern. Previous cycle all-time highs had the MVRV ratio above 3, about double today's reading.
The FOMC (Federal Open Market Committee) maintained the target range for the federal funds rate at 3.75% to 4.00%, after the previous week's hike. Core inflation ticked up to 2.45% from 2.4%, so the real policy rate eased slightly to 1.55%. The 10-year US Treasury yield increased to 5.17%, and the dollar index firmed to 100.97.
What this means for the average investor: Typically, rising yields and a strengthening USD weigh on Bitcoin. However, this week Bitcoin still increased 4.1% against the USD, showing the ETF bid outweighed the macro drag.
Hash rate averaged a record 943.5 EH/s, and total transaction fees were approximately $1.84 million. Miners received $263.7 million, up from $252.1 million, and the average number of transactions per day fell about 8% to 654,000. The average number of active addresses was near 442,000.
What this means for readers: Network security keeps rising. Miners continue to make the bulk of their income from block rewards, and transaction fees account for less than 1% of miner income.
| Level | Price | Why it matters |
|---|---|---|
| Resistance | $90,000 | Nearest heavy block of call options above spot |
| Weekly high | $87,364 | A close above opens the next leg |
| Weekly close | $84,458 | |
| Support 1 | $80,867 | Last week's low, and the first test of the new range |
| Support 2 | $78,718 | True Market Mean, the average cost of active investors |
| Support 3 | $72,763 | Short-term holder cost basis, up from $71,295 |
| Scenario | Trigger | Next level |
|---|---|---|
| Bull case | ETF inflows hold up and price clears $87,364 | $90,000 and the call wall above it |
| Base case | Price holds between $80,867 and $87,364 as leverage stays light | Range while flows are tested |
| Bear case | Weekly close back under $78,718 | $74,000 max pain and the $72,763 cost basis |
The price of 1 BTC in INR was approximately ₹81,00,000. Keep in mind the rupee was at approximately ₹96 per US dollar in September. A weaker rupee lifts the INR price even when the USD price stays the same. So, part of any gain an Indian holder sees comes from the currency, not from Bitcoin.
There hasn't been any change in the tax laws. Gains from Virtual Digital Assets (VDAs, which include cryptocurrency and NFTs in India) are taxed at a rate of 30%, along with a 4% cess. A further 1% is deducted as TDS on transfers. Budget 2026 left these rates unchanged, and the Income-tax Act, 2025 governs all such transactions from 1 April 2026. Losses from the sale of such assets cannot be set off against gains.
Let's look at an example to understand this better. Suppose you bought a VDA at a price of ₹75 lakh and sold it at ₹81 lakh. Your gain would be ₹6 lakh, which would be taxed at ₹1.8 lakh (at 30%), along with a cess of ₹7,200. Further, TDS of ₹81,000 would be withheld by the exchange, and it counts towards your final tax bill.
As reported earlier, data on corporate treasury purchases and the treasury average entry price is not available. Glassnode did not cover it in its latest weekly report, and it remains the only public source for that average. The last data, from Week 37, showed the treasury average entry at about $80,500, now well below the market.
Sources and dates. Price, market cap and dominance from CoinMarketCap (daily closes, 21 to 27 September 2026). Network activity, fees and miner revenue from Token Terminal. Cost basis, holder supply, SOPR, and Realised Cap from BGeometrics (27 September). Hash rate and difficulty from mempool. space. ETF flows from Farside Investors (21 to 25 September). Macro from the Federal Reserve, FRED, and Yahoo Finance. Options from Deribit and futures open interest from CoinGlass (read 29 September). Funding from OKX. Exchange balance and net flow from CryptoQuant (read 29 September). Glassnode BTC Market Pulse for cross-checks. Rupee rate approximate.
India Crypto Research operates independently. The information presented herein is intended solely for educational and informational purposes and should not be construed as financial advice. Before making any financial decisions, it's essential to undertake your own thorough research and analysis. If you're uncertain about any financial matters, we strongly recommend seeking guidance from an impartial financial advisor.


