3. Bitcoin Mining Dashboard
4. Daily Network Data (17–23 October 2026)
5. BTC Production & Miner Revenue
6. Bitcoin Mining Pools
7. Top 5 Bitcoin Mining Countries
8. Top 5 Mineable Proof-of-Work Coins
9. Mining Cost & Profitability
10. ASIC Economics
11. ICR View: Next Week's Outlook (24–30 October 2026)
Data Sources & Methodology

Hashrate kept increasing following the 16 October retarget, and is currently estimated at around 1,050 EH/s (Hashrate Index), about 3% higher than last week.
Blocks were mined about 5% faster than the target (about 151 per day), putting weekly Bitcoin issuance near 3,300 BTC, or about $272 million.
Hashprice settled at around $36.60/PH/day, about 7% lower than last week's pre-adjustment level.
Pool concentration eased slightly: the top three pools accounted for around 62.6% of total blocks (63.2% last week), with SpiderPool reclaiming fifth place from MARA Pool.

 Part of a series
This was the first full week at the new 140.58T difficulty set on 16 October. Hashrate kept growing despite the harder target: Hashrate Index put the network hashrate at approximately 1,050 EH/s on 23 October, a 3% increase from last week's average of 1,019 EH/s. Based on smoothed data, the network remained above 1 ZH/s for the whole week.
Hashrate is still running ahead of difficulty. Because of this, the network continues to produce blocks faster than the 10-minute target. As of 23 October, 1,037 blocks had been mined since the retarget (~151 blocks/day, ~9.5-minute average), about 5% faster than target. Based on current trends, the network is expected to produce about 3,300 BTC in block subsidies this week. This is slightly below last week's pace of ~491 BTC/day.
| Metric | This week (17–23 Oct) | Comment |
|---|---|---|
| BTC price | ~$82.2K avg. (~$81.5K latest) | Average of daily closes; traded $81.4K–$84.1K |
| Network hashrate | ~1,050 EH/s | Hashrate Index, 23 Oct; above 1 ZH/s on smoothed measures |
| Mining difficulty | 140.58T (unchanged all week) | Set at block 971,712 on 16 Oct (+5.92%) |
| Hashprice | ~$36.60/PH/day | Hashrate Index, 23 Oct; down ~7% from last week's ~$39.3 |
| Blocks found (on-chain) | 1,037 since retarget (~151/day) | ~5% faster than target; ~9.5-min average block time |
| BTC block subsidy mined | ~3,300 BTC (7-day pace) | ~151 blocks/day × 3.125 BTC × 7 days |
| Transaction fees (est.) | ~18 BTC | Fees ~0.53% of block reward (Hashrate Index pool data) |
| Next difficulty adjustment | ~+6.6% to ~149.9T | Block 973,728, est. ~29 Oct (CoinWarz / mempool.space) |
| Estimated production cost | ~$58.0K/BTC | At 140.58T; 18 J/TH and $0.06/kWh |
| Date | Day | Hashrate (EH/s) | Difficulty (T) | Blocks | Subsidy (BTC) | BTC mined |
|---|---|---|---|---|---|---|
| 17-Oct-26 | Saturday | 979 | 140.58 | 140.09 | 3.125 | 437.79 |
| 18-Oct-26 | Sunday | 1,240 | 140.58 | 177.44 | 3.125 | 554.51 |
| 19-Oct-26 | Monday | 1,120 | 140.58 | 160.27 | 3.125 | 500.85 |
| 20-Oct-26 | Tuesday | 1,140 | 140.58 | 163.13 | 3.125 | 509.79 |
| 21-Oct-26 | Wednesday | 1,180 | 140.58 | 168.86 | 3.125 | 527.68 |
| 22-Oct-26 | Thursday | 929 | 140.58 | 132.94 | 3.125 | 415.44 |
| 23-Oct-26* | Friday | 1,030 | 140.58 | 147.39 | 3.125 | 460.60 |
| Week | Total / avg. | 1,088 avg. | 140.58 | 1,090.13 | 3.125 | 3,406.66 |
Hashrate: CoinWarz daily (UTC) network estimates. Blocks and BTC mined are implied from hashrate and difficulty (blocks = hashrate × 86,400 ÷ (difficulty × 2³²)), the same method used in previous editions. * 23 October is a partial day (data to ~09:00 UTC). CoinWarz 1-day estimates are noisy and run about 3% above the on-chain block count (1,037 blocks since the retarget ≈ 151/day ≈ 1,056 EH/s), so the dashboard uses the on-chain figures.
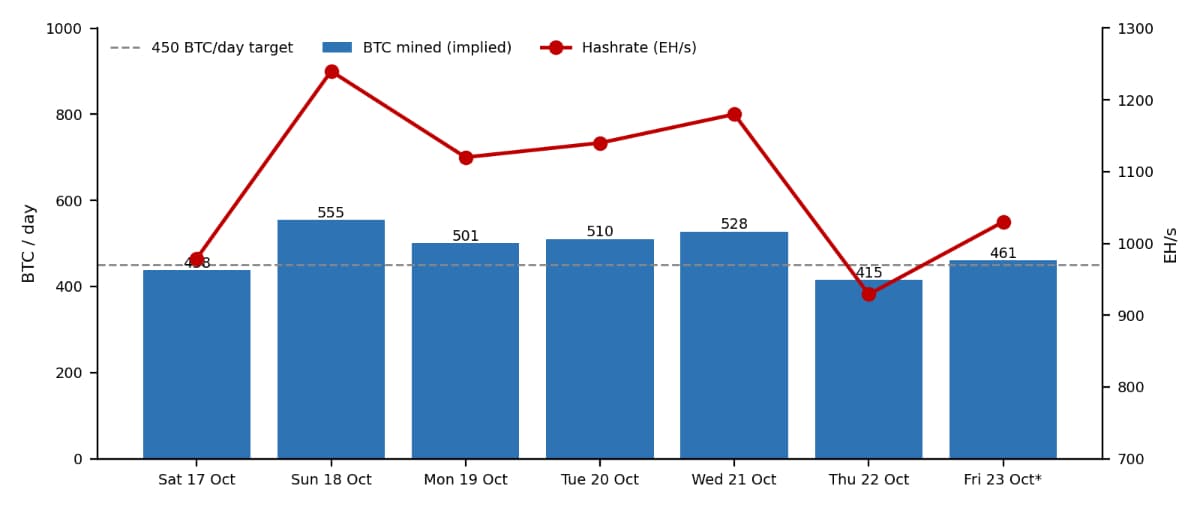
Chart: daily implied BTC mined (bars) against CoinWarz daily hashrate (line). Dashed line marks the 450 BTC/day target at 144 blocks/day.
Readings taken during the week of 17–23 October fluctuated significantly, from 929 EH/s on Thursday 22 October to 1,240 EH/s on Sunday 18 October. Swings of this size in a single day mostly reflect normal luck in block discovery rather than machines switching on and off. The smoother on-chain measure of ~151 blocks mined per day is the better guide to the week.
Mining activity for the week is estimated to have generated ~3,300 BTC. Each day, an estimated 472 BTC were produced. This is a 4% decrease from last week, when ~491 BTC were produced per day, because the higher difficulty slowed block production. Transaction fees remained small, at approximately 0.5% of the block reward.
| Component | Weekly BTC (7-day pace) | Approx. share of block subsidy |
|---|---|---|
| Block subsidy | ~3,300 BTC | 100% |
| Transaction fees (est.) | ~18 BTC | ~0.53% |
| Approx. USD value of subsidy | ~$272M | At ~$82.2K average BTC price |
| Rank | Mining pool | Blocks | Approx. hashrate (EH/s) | Approx. share |
|---|---|---|---|---|
| 1 | Foundry USA | 278 | 277.27 | 26.28% |
| 2 | AntPool | 211 | 210.45 | 19.94% |
| 3 | F2Pool | 173 | 172.55 | 16.35% |
| 4 | ViaBTC | 91 | 90.76 | 8.60% |
| 5 | SpiderPool | 70 | 69.82 | 6.62% |
| 6 | MARA Pool | 56 | 55.85 | 5.29% |
| 7 | SECPOOL | 52 | 51.86 | 4.91% |
| 8 | Luxor | 43 | 42.89 | 4.06% |
| 9 | OCEAN | 30 | 29.92 | 2.84% |
| 10 | Braiins Pool | 19 | 18.95 | 1.80% |
| 11 | Binance Pool | 11 | 10.97 | 1.04% |
| 12 | Unknown | 9 | 8.98 | 0.85% |
| 13 | BTC.com | 7 | 6.98 | 0.66% |
| 14 | WhitePool | 5 | 4.99 | 0.47% |
| 15 | Poolin | 3 | 2.99 | 0.28% |
| Total | 1,058 | 1,055.22 | 100% |
Pool block counts, hashrate and shares as compiled by ICR from block-attribution data on 23 October 2026 (1,058-block sample).
Compared with last week, total pool hashrate rose about 3.6%, to ~1,055 EH/s from ~1,019 EH/s, while concentration eased slightly. The top three pools produced 62.6% of blocks (last week, 63.2%), and the top five pools 77.8% of blocks (last week, 79.5%). Foundry USA rose to 26.3% (+0.8 pts), and AntPool lost 1.5 pts to 19.9%. ViaBTC lost 1.6 pts to 8.6%. SpiderPool rose 1.6 pts to 6.6%, retaking fifth spot and pushing MARA Pool back to sixth (5.3%). SECPOOL also gained 1.3 pts to 4.9%. Binance Pool edged up to 1.0% ahead of its planned closure on 10 November.
Pool Outlook
During the week, Foundry USA (~26.3%), AntPool (~19.9%) and F2Pool (~16.4%) combined accounted for about 62.6% of the total blocks found. The main change ahead is the closure of Binance Pool on 10 November. At about 1.0%, Binance Pool's share is small, but the miners leaving it will likely join large FPPS pools, such as AntPool, F2Pool, ViaBTC and SpiderPool, so we expect the top-five share to rise from about 78% to around 79–80% over the next three weeks. Week to week, the fifth and sixth spots (SpiderPool and MARA Pool, about 1.3 points apart) are likely to keep swapping on normal block luck, and we wouldn't place much importance on either result.
| Rank | Country | Approx. share | Approx. hashrate |
|---|---|---|---|
| 1 | United States | 35.6% | ~374 EH/s |
| 2 | Russia | 18.1% | ~190 EH/s |
| 3 | China | 11.7% | ~123 EH/s |
| 4 | Paraguay | 4.8% | ~50 EH/s |
| 5 | Oman | 3.0% | ~32 EH/s |
Shares from the Hashrate Index Q4 2026 Global Hashrate Heatmap (unchanged); hashrate implied by applying each share to ~1,050 EH/s.
| Coin | Algorithm | Price | Difficulty | Network hashrate | Key mining characteristic |
|---|---|---|---|---|---|
| BTC | SHA-256 | $81,505.89 | 140.58T | 1,062 EH/s | Largest PoW network; halving-driven subsidy |
| ZEC | Equihash | $1,217.73 | 291.71M | 31.17 GH/s | Privacy-focused PoW asset |
| DOGE | Scrypt | $0.08 | 39.80M | 2.757 PH/s | High issuance; merged-mined with LTC |
| XMR | RandomX | $608.88 | 739.87B | 6.166 GH/s | CPU-friendly, ASIC-resistant privacy coin |
| BCH | SHA-256 | $286.02 | 509.71B | 3.827 EH/s | Shares SHA-256 mining ecosystem with BTC |
Source: minerstat.com/coins, live snapshot taken 23 October 2026, top 5 coins in Minerstat's default ranking.
XMR and ZEC have risen ~9% and ~6% respectively since the 17 October snapshot and are currently trading at around ~$609 and ~$1,218. The DOGE network hashrate fell back by ~31% to ~2.8 PH/s after last week's jump, and BCH difficulty increased by ~7% to ~510B. LTC, at ~2.717 PH/s, remains sixth.
Illustrative electricity-only production costs at the current 140.58T difficulty, and at the ~149.9T expected after the next retarget:
| Scenario | Electricity / efficiency | Cost at 140.58T | Cost at ~149.9T (est.) |
|---|---|---|---|
| Efficient operation | $0.05/kWh, ~12 J/TH | ~$32K | ~$34K |
| Mid-case | $0.06/kWh, ~18 J/TH | ~$58K | ~$62K |
| Older fleet | $0.06/kWh, ~35 J/TH | ~$113K | ~$120K |
At a ~$81.5K BTC price, the mid-case gross spread (electricity at $0.06/kWh, machines at ~18 J/TH) is about ~$23.5K/BTC, or ~29% of BTC price, unchanged from the end of last week. Post-retarget it would be ~$19.7K, or ~24% of BTC price, if BTC stays flat. This is not corporate net profit: debt service, depreciation, hosting, staff, maintenance, SG&A and financing costs are excluded.
| Indicator | What to track each week |
|---|---|
| ASIC hashrate | TH/s per machine |
| Energy efficiency | J/TH |
| Power consumption | kW per machine |
| Revenue | BTC/US$ per day (≈0.000447 BTC per PH/s/day at 140.58T) |
| Electricity expense | US$/day at selected tariff |
| Gross mining margin | Revenue less electricity |
| ASIC payback | Months at current economics |
An ASIC covers its electricity cost when tariff × J/TH is below ~1.53 at ~$36.60/PH/day (e.g. ~$0.06/kWh × ~25 J/TH). After a +6.6% retarget, hashprice near ~$34.3/PH/day would lower that threshold to ~1.43 (~$0.06/kWh × ~24 J/TH).
Difficulty: With ~980 blocks left in the epoch, and blocks arriving ~5% faster than target, we expect a retarget around 29 October, upward by ~+5% to ~+7%, to a level of ~148–150T. Our base case is ~+6.6% to ~149.9T.
Hashprice: If BTC stays around ~$81–82K, we expect hashprice to fall to ~$34–35/PH/day after the retarget. To keep hashprice at today's ~$36.60/PH/day post-retarget, BTC would need to rise to ~$86.9K.
Hashrate: Expect a slower growth rate due to the greater difficulty, with hashrate likely to hold in the range of 1,030–1,070 EH/s, rather than climbing at this week's pace. Older fleets are the first to turn off or move to AI/HPC hosting.
Network hashrate (1,050.47 EH/s), hashprice ($36.60/PH/day), BTC price, and block time are from Hashrate Index (hashrateindex.com), read on 23 October 2026. The Hashrate Index data platform loads only in a browser, so its daily series could not be read directly. Pool data was compiled by ICR from block-attribution data on 23 October. Coin data from Minerstat; country shares from the Hashrate Index Q4 2026 Global Hashrate Heatmap. Fees are taken as ~0.53% of the block reward, the average shown in the Hashrate Index pool table. Production-cost figures are illustrative, electricity-only calculations.
India Crypto Research operates independently. The information presented herein is intended solely for educational and informational purposes and should not be construed as financial advice. Before making any financial decisions, it's essential to undertake your own thorough research and analysis. If you're uncertain about any financial matters, we strongly recommend seeking guidance from an impartial financial advisor.